| planetary tilt/earth cycles |
|
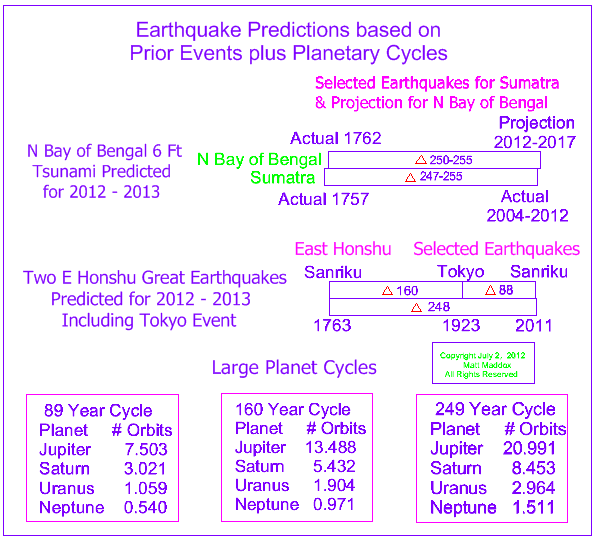
earthquake predictions based on prior events earthquakes predicted for n bay of bengal and e honshu
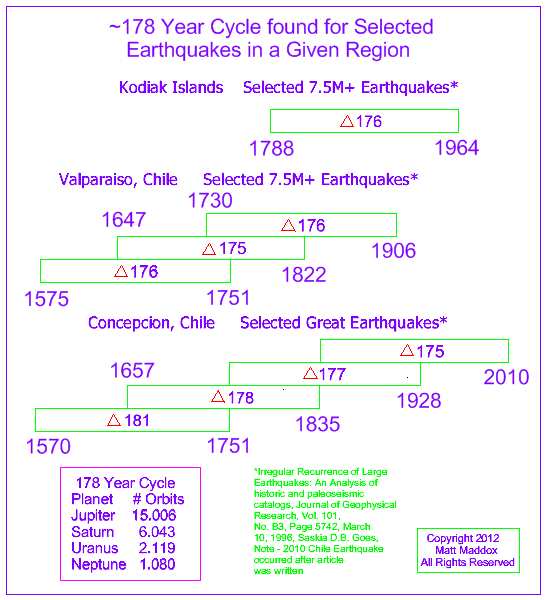
~178 year large planet cycle found for earthquakes in a given region
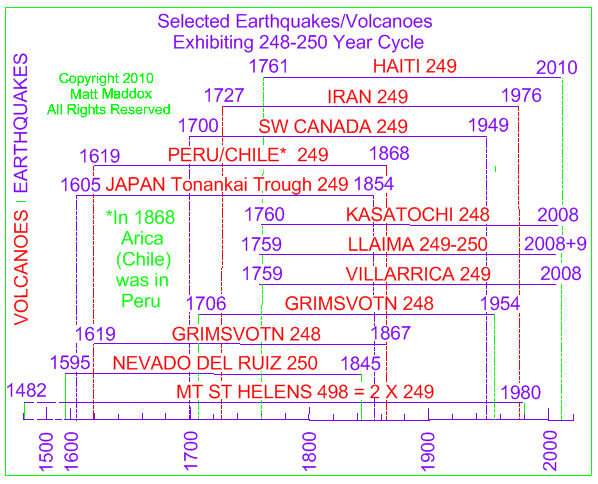
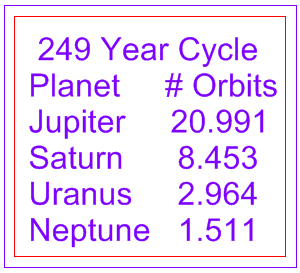
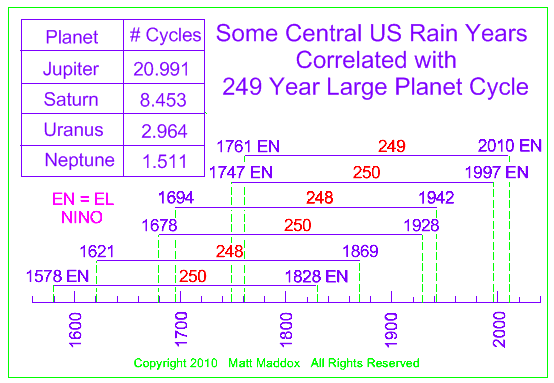
249 year large planet cycle causes repetitive earthquakes/volcanoes kasatochi predictor for haiti groupings of events are caused by the planetary patterns. note the grouping of volcanic eruptions of villarrica, llaima & kasatochi in 1759-60 along with the two earthquakes of haiti in 1761. 248-250 years later the same sequence occurs. villarrica and llaima had intervening eruptions, but the only two certain eruptions of kasatochi (in alaska) happened 248 years apart. kasatochi, in concert with the two volcanoes in chile, could in this case, be considered predictors for the 2010 haiti earthquake. the two largest recorded earthquakes in canada's history (both located in sw canada) occurred 249 years apart, matching the 249 year planet pattern shown in the diagram immediately below. so even earthquakes that seem to be completely unrelated by geography or time can be indicators for later earthquakes in another part of the globe. carefully selected and analyzed, certain earthquakes of canada can be predictors for haiti's earthquakes, when viewed from the global long-term perspective.
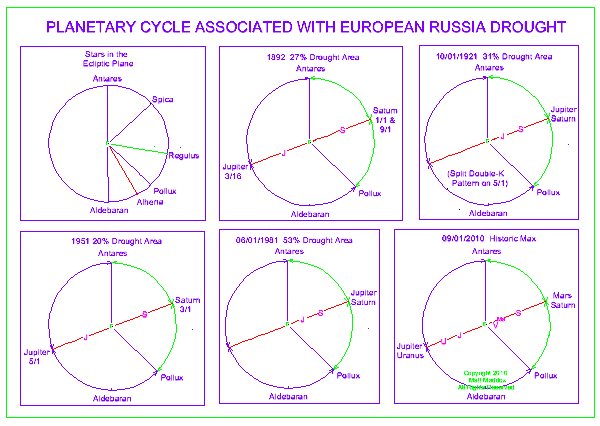
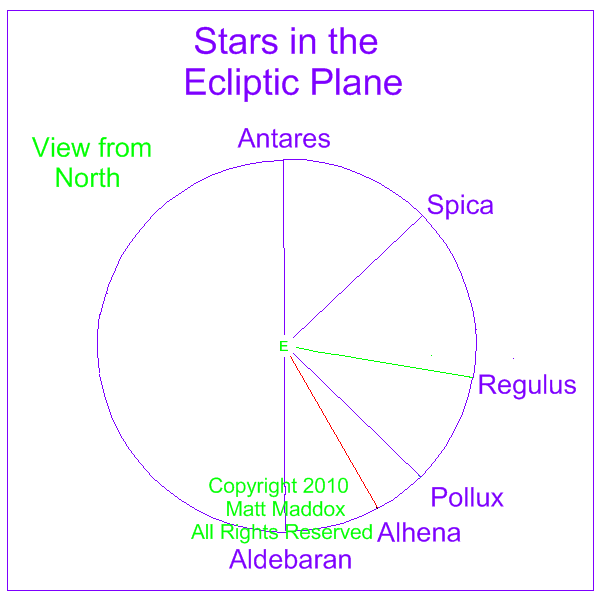
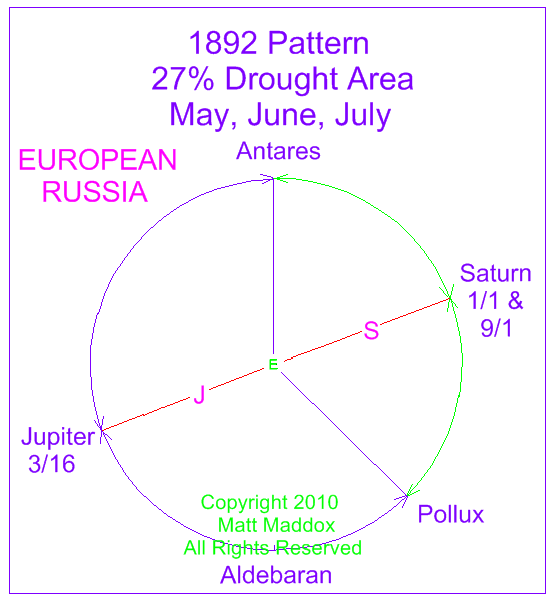
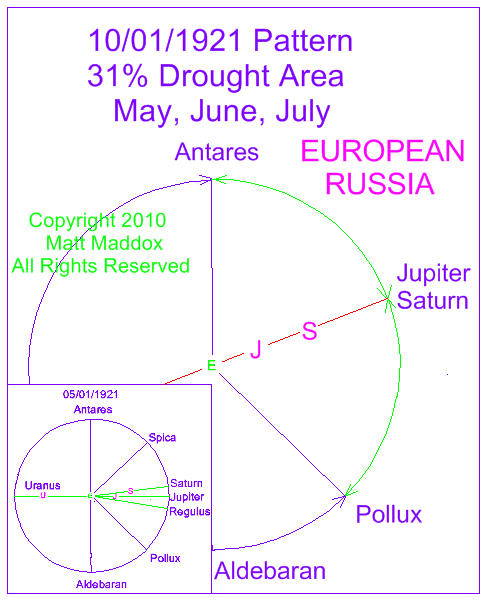
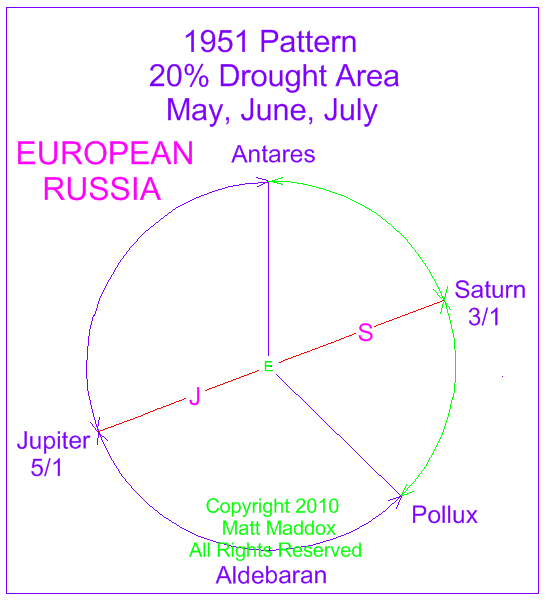
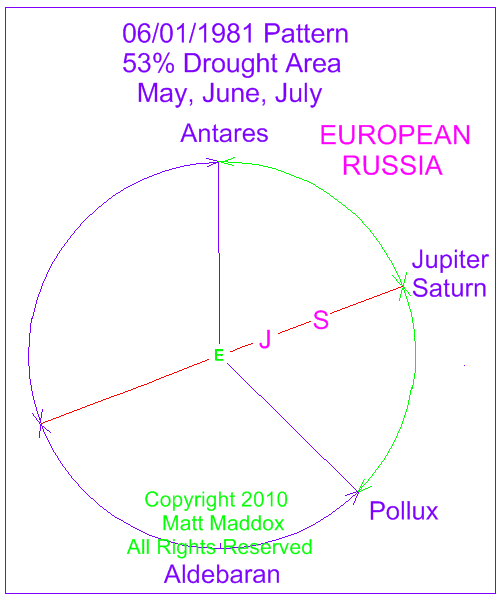
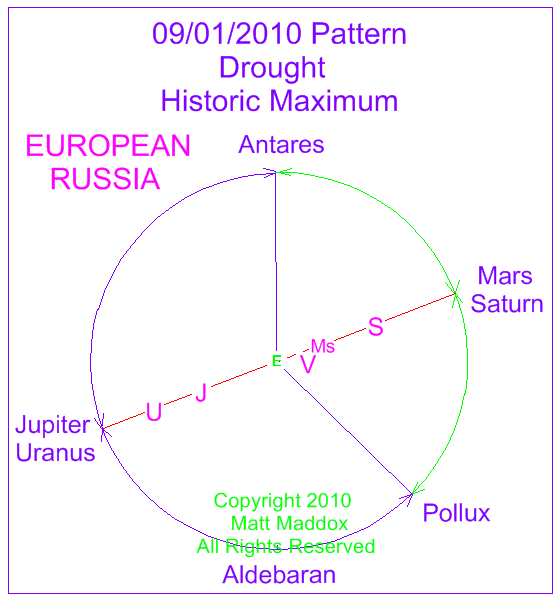
european russia drought associated with planetary cycle a repetitive jupiter/saturn alignment along a specific axis is associated with some cases of drought in european russia. this axis splits the angle between two ecliptic stars - antares and pollux. a rare alignment of uranus, jupiter, earth, mars and saturn is linked to the extreme drought of 2010 around moscow. this alignment was followed by another rare line-up of uranus, jupiter, earth, venus and saturn. drought percentage is based on meshcherskaya/blazhevich (1). the article analyzes climate data of may, june and july for years listed in the table. the 1921 and 1981 patterns are almost exact duplicates- however the 1921 pattern occurs in october, after the growing season. a different symmetry appears in may of 1921. (1) the drought and excessive moisture indices in a historical perspective in the principal grain-producing regions of the former soviet union, a v meshcherskaya, v g blazhevich, journal of climate, vol 10, p 2670, copyright 1997 american meteorological society
wet/snowy 2010 had 249 year predecessor snow on the ground in 49 states during the olympics, floods in fargo north dakota, mass power outages from fierce storms in the northeast - where did it all come from? this was not the first time washington dc has seen lots of snow, and it wasn't the first time almost the whole country has been wet. for a washington dc snow cycle please see the 88 year astronomical cycle described below. to see a year when almost the whole country was really wet, try this site : http://ncdc.noaa.gov/cgi-bin/paleo/pd04plot.pl type 1761 in the box that says "years" -then click on update spreadsheet. there is a 249 year difference, or delta, between 1761 and 2010. the large planets show half/whole orbital cycles at 249 years and this affects everything from volcanoes to earthquakes to climate conditions. for a sequential satellite view of snow cover around fargo, nd go to: http://www.ndsu.edu/fargoflood/snowcover_2010/js_movie.html see the selected earthquakes/volcanoes diagram below to see how the events of 1759 - 1761 have been repeated in the last few years.
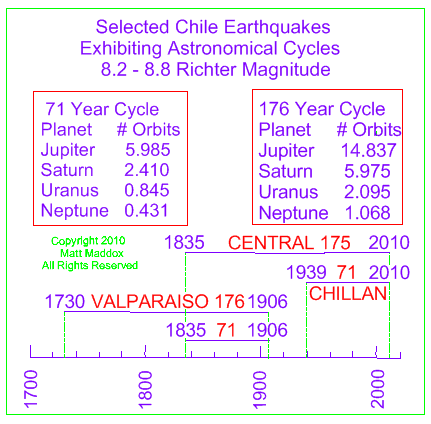
chile earthquakes consequence of large planet periodic cycles about every 178 years the large planets line up within about 5-10 degrees. this rough alignment is called syzygy (syz-ih-gee). each of the large planets exhibit approximately whole orbital cycles at this time range of about 177-179 years. in 1835 a large earthquake - 8.2 magnitude - hit central chile at concepcion. the large planets were not in syzygy at this time. but 175 years later in 2010- very close to the syzygy range of 178 years- an 8.8 magnitude quake rocked the area again. please understand that the planets were not in syzygy at this time either. this means that the planetary pattern, also known as configuration, of the large planets was very similiar. the only exception was jupiter at 14 + 3/4 cycles. note the 71 year cycles which appear related to the syzygy cycles shown. at 71 years the large planets show approximate whole and half cycles. the combination of whole and half cycles have the same effect as all whole cycles - in this case large earthquakes in central chile! for a fascinating read on darwin's experience with the 1835 quake, access: http://www.cnn.com/2010/opinion/03/01/vanwyhe.quake.chile.darwin/index.html
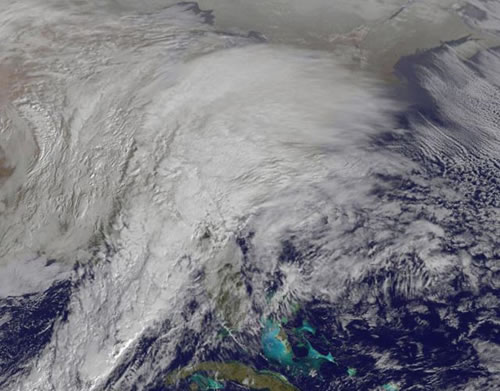
feb 5, 2010 mid-atlantic storm - nasa goes nasa does not endorse private websites
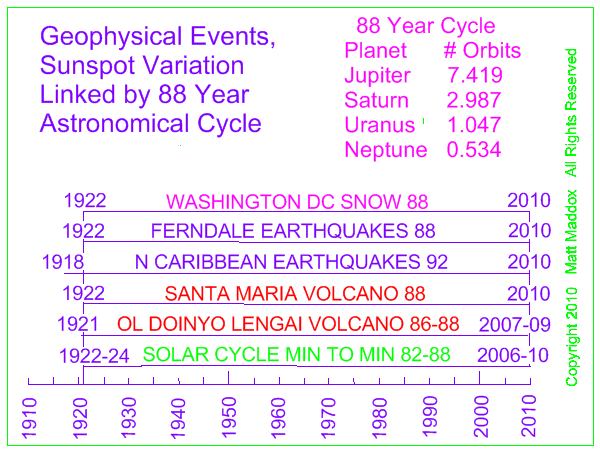
88 year large planet cycle links earthquakes, volcanoes, solar cycle & washington dc snowstorms a cluster of specific events occurred around 1920 - 1) solar cycle minimum in 1923
2) ol doinyo lengai eruption in 1921 in e africa
3) santa maria eruption in 1922 in guatemala
4) n caribbean earthquake in 1918 5) 7.3 magnitude earthquake near ferndale, ca 6) washington dc knickerbocker storm with a record 28-inch snowfall. the cluster repeated again about 2010 - with an offset or delta of about 88 years between events. of course, there were intervening events in most cases, such as other solar cycle minimums. the jan 27-28, 1922 knickerbocker storm was followed closely by the january 31, 1922 ferndale earthquake. the jan 10 (mg 6.5) and feb 4 (mg 5.9)ferndale earthquakes were closely associated with the feb 5-6, 2010 washington dc snowstorm - dubbed "snowmaggedon" - which deposited a near-record 25.5 inches of snow. all these events, including the solar cycle, are controlled by large planet position and orientation. at 88 years saturn and uranus are at approximate repeat positions. both jupiter and neptune show half-cycles and have similiar effects on both sun and earth relative to start position 88 years earlier.
124-125 year volcano/climate cycle caused by large planet tilt presentation volcanic eruptions and climate repeats have been found at 124-5 year intervals. they are associated with large planet cycles in which the planets exhibit different orientations toward the earth at different times. although a large planet such as saturn is tilted toward the same point in the sky over a long period of time, it will present an equatorial or edge-on facing toward the earth at one point and about 7 years later will present the most polar possible facing at about 27 degrees (1). neptune does the same but the cycle from equatorial to polar is about 41 years with a tilt of about 28 degrees (2). (1) http://www.crh.noaa.gov/fsd/astro/saturn.php
(2) http://www.crh.noaa.gov/fsd/astro/neptune.php
intrasite links tropical storms tornadoes solar system
climate/el nino/la nina nuclear power outage/aviation accidents earthquakes/clear air turbulence
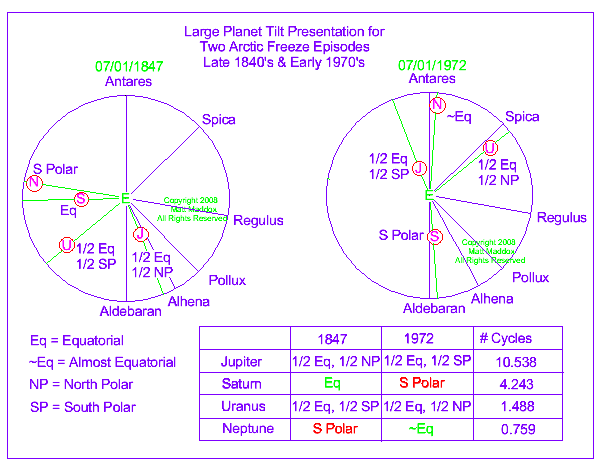
two arctic freeze episodes late 1840's and early 1970's
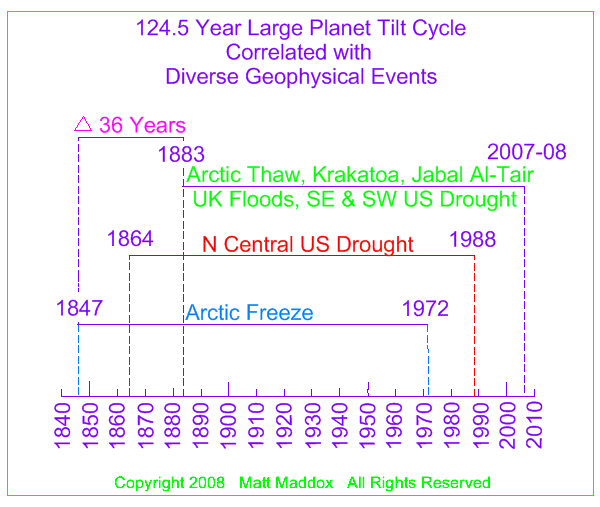
in the summer of 1845 an experienced explorer sir john franklin set off in search of the northwest passage to asia (1). he never made it because the arctic was in the beginning of a five-year freeze in which the polar ice did not thaw during the summer. this was the exact time of the irish potato famine. yet 58 years later, roald amundsen was successful in navigating the passage. what happened? it turns out that the five-year freeze scenario repeated again in the early 1970's. an analysis of large planet tilt presentations shows an interesting property at 124.5 years. at 10 1/2 revolutions, jupiter flips positions in the sky relative to where it started at the beginning of the cycle. it also reverses its orientation to earth (2). at 1 1/2 revolutions, uranus does the same. but saturn and neptune, and only at periodic times, do something different. first, they are at similiar tilts, although they face toward different points in the sky. second, they alternate orientations with each other every 124-125 years. in the arctic freeze case, saturn started off roughly equatorial in the late 1840's. in the early 1970's it presented a south polar facing. neptune, on the other hand, started off with a south polar orientation in the late 1840's and then exhibited an approximately equatorial face in the early 1970's. the net effect of all the large planet facings resulted in a constant arctic freeze for the two periods indicated. as mentioned, amundsen was successful in his attempt from 1903 to 1906. it turns out that jupiter and saturn have a 5 : 2 resonance at 59 years. this means that jupiter, after 5 revolutions, was at the same region of the sky during amundsen's expedition as compared to that during franklin's. the same applies to saturn in its position. however, uranus completed 3/4 of a revolution and neptune also a fraction at 3/8. so the change in orientation of uranus and neptune contributed to, and allowed the summer arctic thaw. the planetary configurations and the climate scenario for the two expeditions could be viewed as a classic scientific experiment. with jupiter and saturn's position being almost identical for both expeditions, the combination of uranus and neptune's position/facing could be considered as the independent variable with the arctic climate being considered the dependent variable. with jupiter and saturn's position as a given, a change in the combo of uranus and neptune results in a change for the arctic climate!
(1) nova - arctic passage, re-run 2007; roy m koerner - ice core researcher (2) dance of the planets, arc simulations
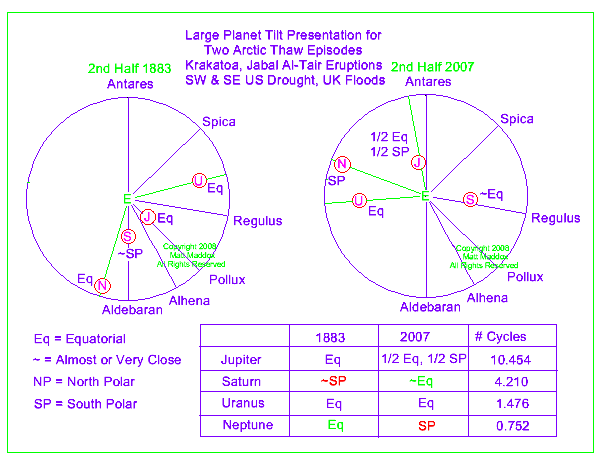
two arctic summer thaw episodes krakatoa, jabal al-tair eruptions sw & se us drought, uk floods 1883 and 2007 in 1883 the combination of the following geophysical events took place: 1) arctic summer thaw as evidenced by activity of vessels near the arctic circle and west of greenland in search of an 1881 expedition (1). 2) historic eruption of krakatoa (2) 3) eruption of jabal al-tair in the southern red sea (3) 4) southern california drought (4) 5) southeast us drought (5) 6) floods in great britain (6) in 2007 the same combination of geophysical events repeated:
7) massive arctic summer thaw (7) 8) eruption of krakatoa (3) 9) eruption of jabal al-tair in the southern red sea (3) 10) southern california drought (8) 11) southeast us drought (9) 12) floods in great britain (10) (11) in a 36-year offset from the freeze cycle, jupiter starts with an equatorial facing in 1883 and will peak with the same in 2008. uranus is equatorial for 1883 and 2007-08. neptune is equatorial for 1883 and becomes south polar for 2007-08. saturn is approximately south polar in 1883 and becomes close to equatorial in 2007-08. in addition to the massive 2007 arctic summer thaw, numerous volcanoes have erupted with increasing intensity from the fall of 2007 through early february 2008. a february 6, 2008 eruption of tungurahua in ecuador resulted in a 47,000 ft ash plume. this was almost exactly the height expected as detailed in the january 15, 2008 update under predictions 2008. the eruption was close to the early february predictive date of feb 2 plus or minus 2 days. another cycle intervened between the artic freeze and thaw cycles. in both 1864 and 1988 the north central us experienced extreme drought conditions (12). the 1988 drought resulted in the climactic fires at yellowstone park. at 124 years, as expected, jupiter reverses positions in the sky and thus the tilt presentation, in this case from south polar to north polar. uranus does the same, initiating in 1864 with a 2/3 south polar tilt and ending in 1988 with a 2/3 north polar tilt. saturn, at 4.2 cycles, shows an approximate mirror-image change from 1/2 eq, 1/2 np to 1/3 eq, 2/3 np presentation. and neptune, at 0.75 cycles, shows a definite mirror-image change from 1/2 eq, 1/2 sp to 1/2 eq, 1/2 sp. neptune, at 3/4 of a revolution around the sun, effectively rotates about its polar axis to produce the mirror-image presentation. a saturn-uranus-galactic center line-up with resultant symmetry was contributory to the historic fires experienced in the summer of 1988. two other volcanoes show repeat cycles in 1883 and 2007. both ol doinyo lengai in e africa and sheveluch in russia (2) showed a vei 2 eruption in 1883 and each had eruptions in november of 2007 - 124 years later! other evidence of the 124.5 year cycle comes from sediment cores originating in a lake in the yucatan peninsula. these cores point to a 125 year climate cycle (13). two of the dry peaks for the mayan drought era occur at about 862 and 986 ad (13). these dates are 124 years apart and exemplify the 124.5 year tilt cycle quite nicely. volcano vesuvius showed a 124 year gap with its massive eruption in ad 79 and a milder one in ad 203. (14) a 249-year cycle is evidenced by earthquakes around the us northwest. on january 26, 1700 a major earthquake occurred at the cascadia subduction zone. on april 13, 1949 a 7.1 magnitude quake shook seattle, washington. at 249.21 years jupiter and uranus show almost whole cycles of revolutions. saturn and neptune show whole plus half cycles! so at 249 years the large planets end up on the same axis on which they began 249 years earlier! there is further evidence of the 124.5 and 249 year cycles with el nino occurrences. there are cycles of approximately 124-125 and 249 years with el ninos. however, the large planet tilt evidence is not completely clear for these cycles. the smallest increment found for large planet cycles is 41.5 with jupiter, saturn and uranus doing approximate flips in the sky. neptune shows a 1/4 cycle for this period. depending on the cycle stage, neptune can show a mirror-image at 1/4 cycle. the 1964 alaska and 2005 pakistan earthquakes show this approximate flip for j, s and u! at 83 years, jupiter returns to the same spot in the sky. uranus repeats within about 3 degrees. neptune shows up on the same axis, but at an opposite point in the sky. and saturn can show a mirror image in regards to tilt. clough discusses several 83-year cycles (15) .
(1) ny times, september 14, 1883 - lost in the arctic ice (2) volcanoes of the world, tom simkin, lee siebert, geoscience press, 1994, smithsonian institution (3) volcano.si.edu (reports) (4) pe.com/localnews/inland/stories/pe_news_local_d_water21. 3e42a7f.html - riverside, ca driest since 1883
(5) ny times, october 7, 1883; article generated from mobile, al - author's note - this se us drought will not show up on the annual pdsi maps as described below. however, the newspaper article describes a severe drought from n texas to georgia that occurred just as the cotton harvest was to happen.
(6) http://www.eng.ox.ac.uk/samp/slides/oxjan08-marshterry.pdf terry marsh - a review of major floods in the thames basin
(7) arctic.atmos.uiuc.edu/cryosphere/sea.ice.minimum.2007.html (8) climate.water.ca.gov/docs/california_climate_summary_112007.pdf/ (9) http://www.weather.gov/oh/hic/current/drought/ffc.htm - peachtree city, ga 1/11/08 (10) http://news.bbc.co.uk/2/hi/uk_news/6916724.stm 2007 uk floods (11) news.bbc.co.uk/2/hi/in_depth/629/629/691/78.stm july floods: at-a-glance may 1 to july 22, 2007 (12) http://www.ncdc.noaa.gov/cgi-bin/paleo/pd04plot.pl - pdsi maps- go to first map, type 1864, tab, type 1988, click on update spreadsheet (13) solar forcing of drought frequency in the maya lowlands, david a hodell, mark brenner, jason h curtis, thomas guilderson, science, 18 may 2001: v292, no 5520, pp 1367-1370, doi : 10.1126/science. 1057759 (14) encyclopedia of volcanoes, sigurdsson, academic press, c2000 p 1368 (15) the 11-year sunspot period, secular periods of solar activity...h.w. clough, monthly weather review, vol 60, no 4, april 1933 http://docs.lib.noaa.gov/rescue/mwr/061/mwr-061-04-0099.pdf
|
copyright 2007 astrosymm
all rights resrved
